Example Bioinformatics Visualizations
RShiny website for interactive bulk RNA-seq analysis
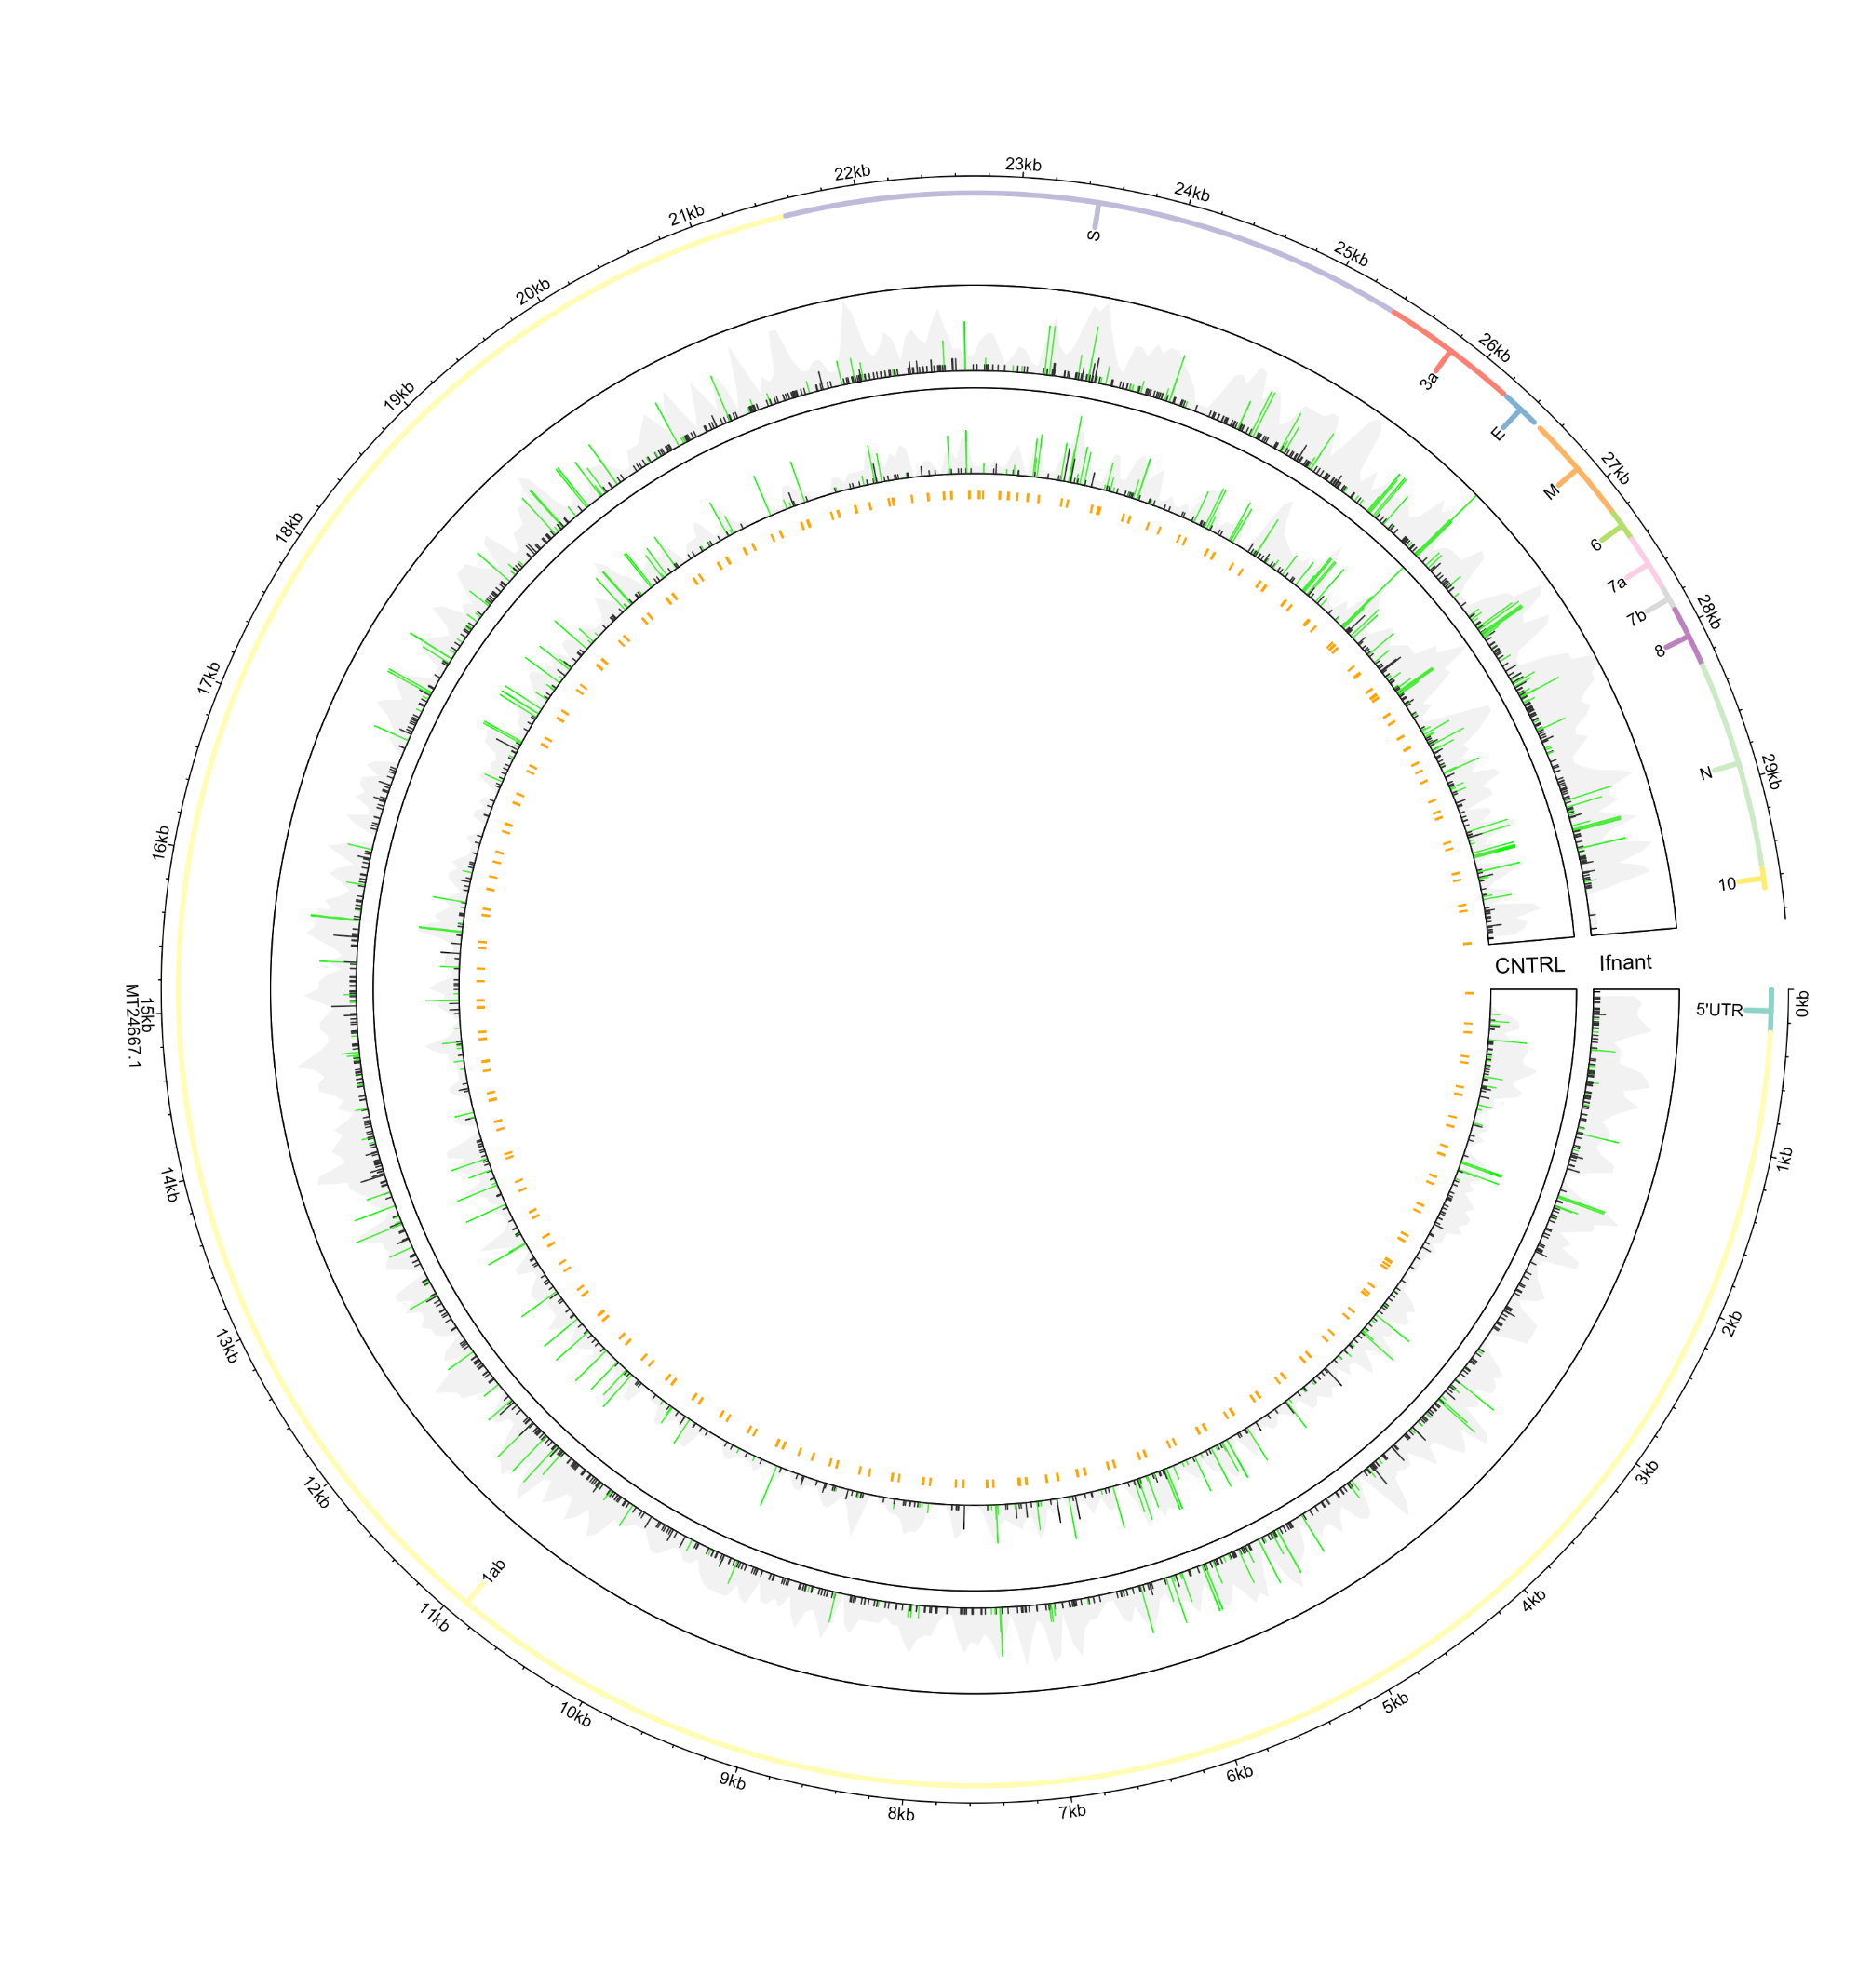
Tracking mutation hotspots in COVID samples
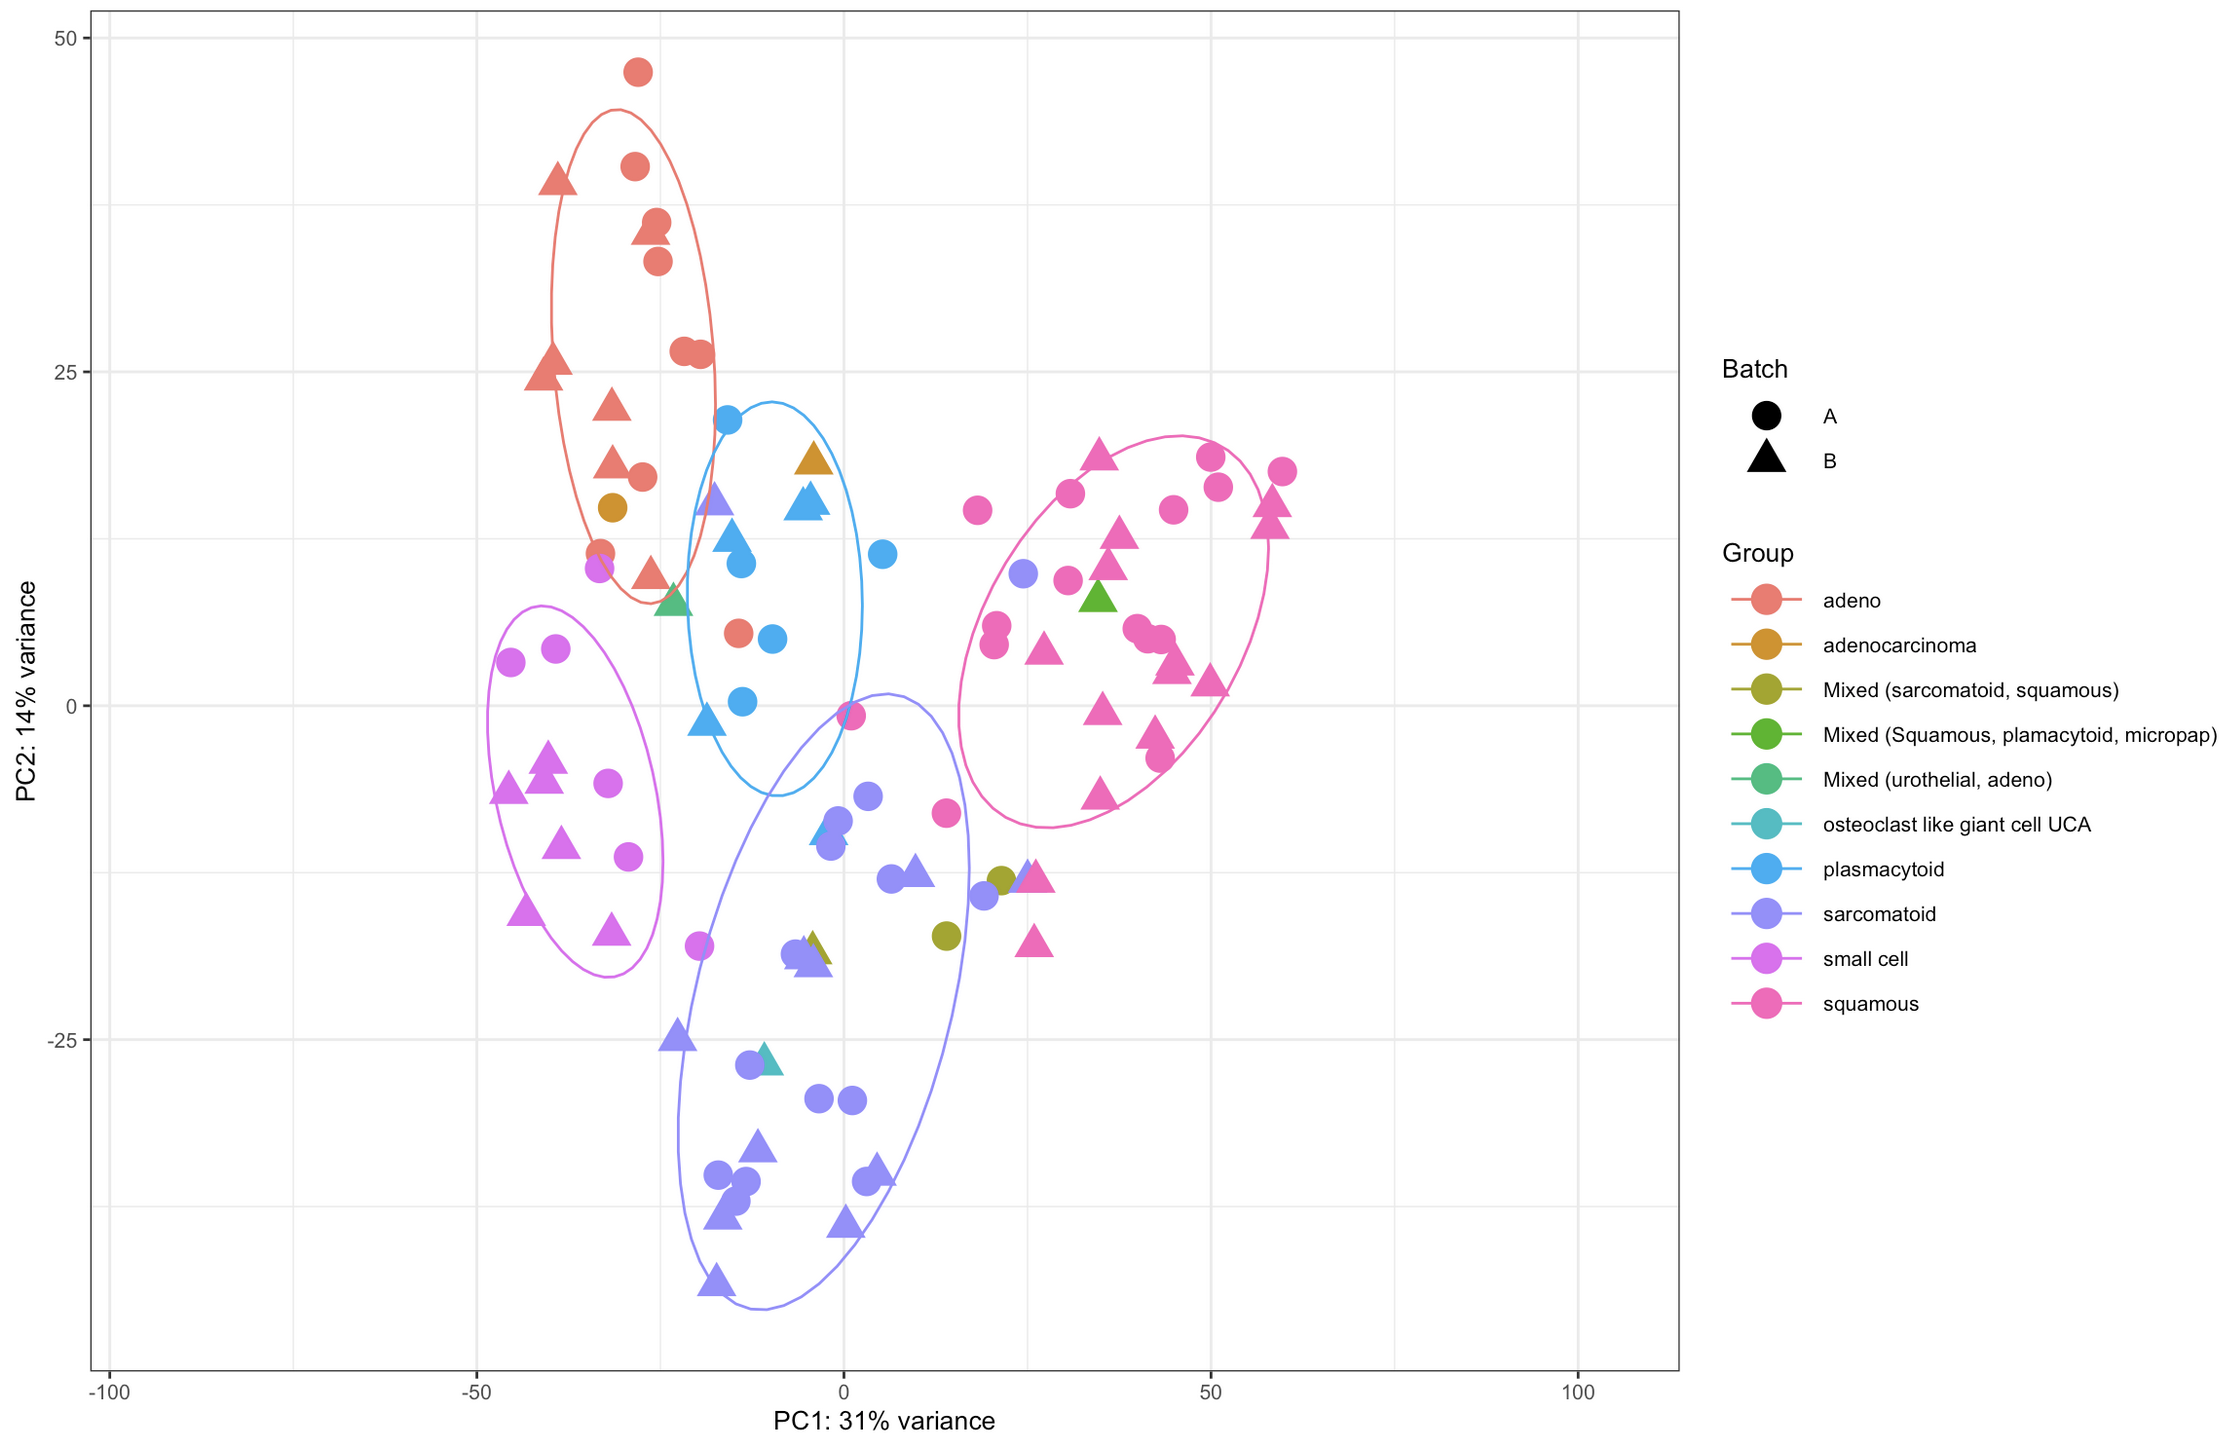
PCA visualization with histology elipsoids
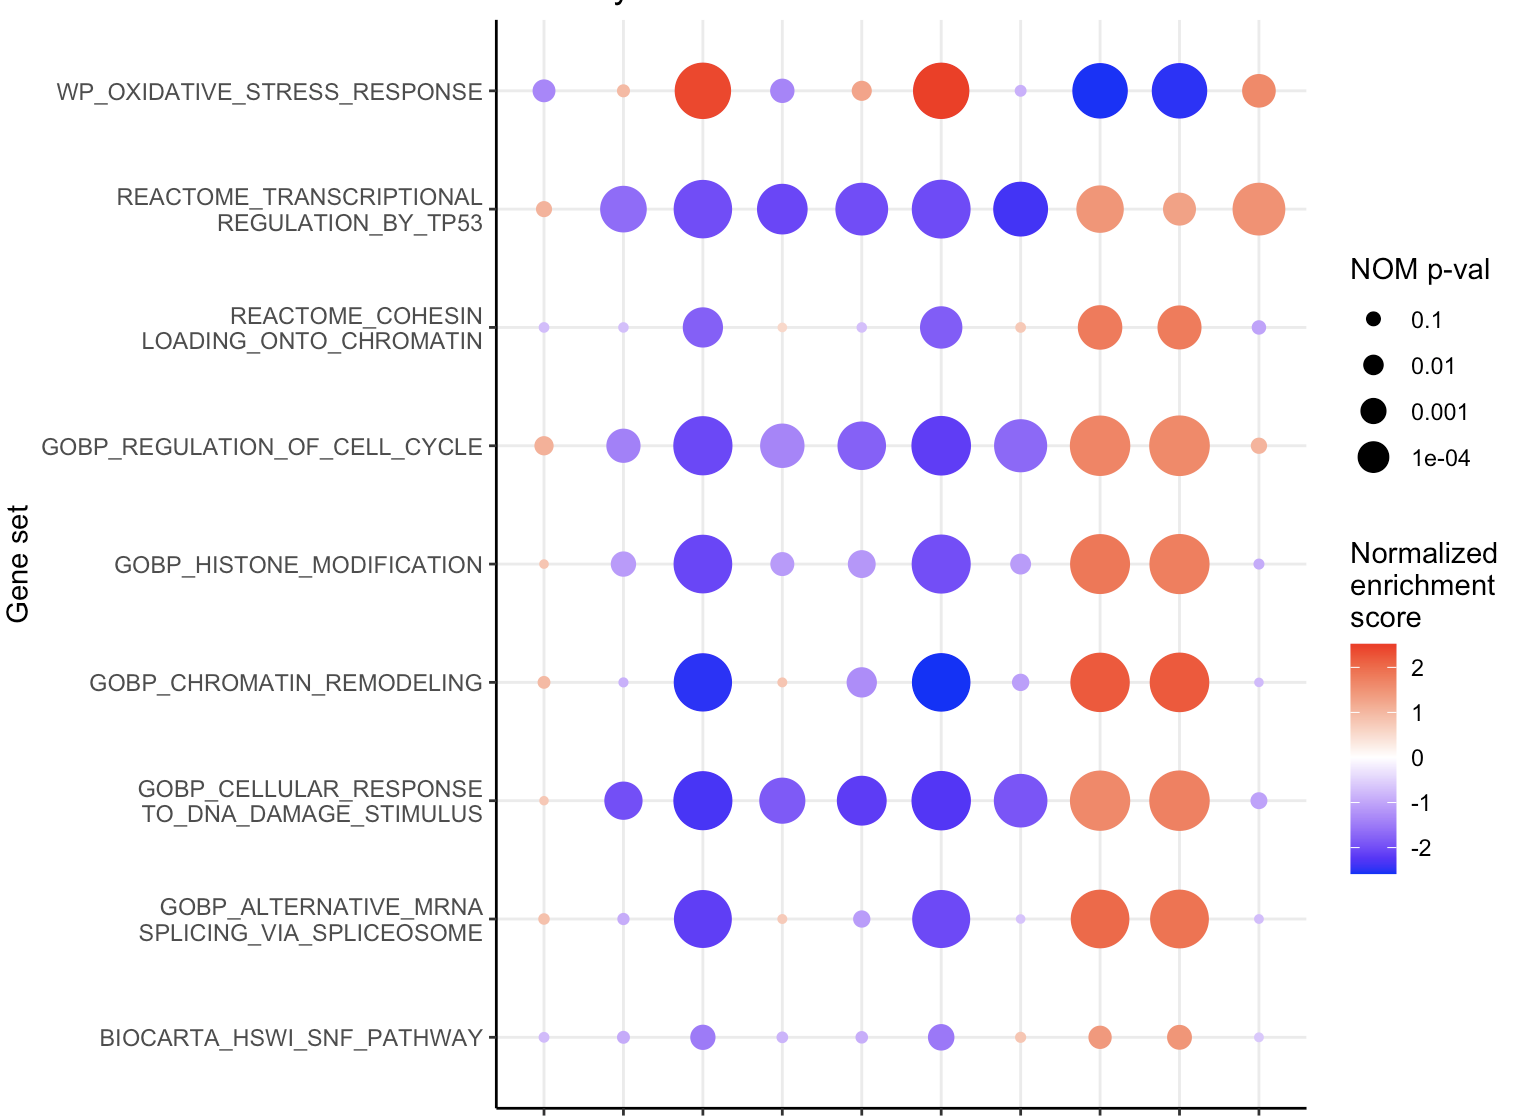
Pathway enrichment in bulk RNA-seq studies
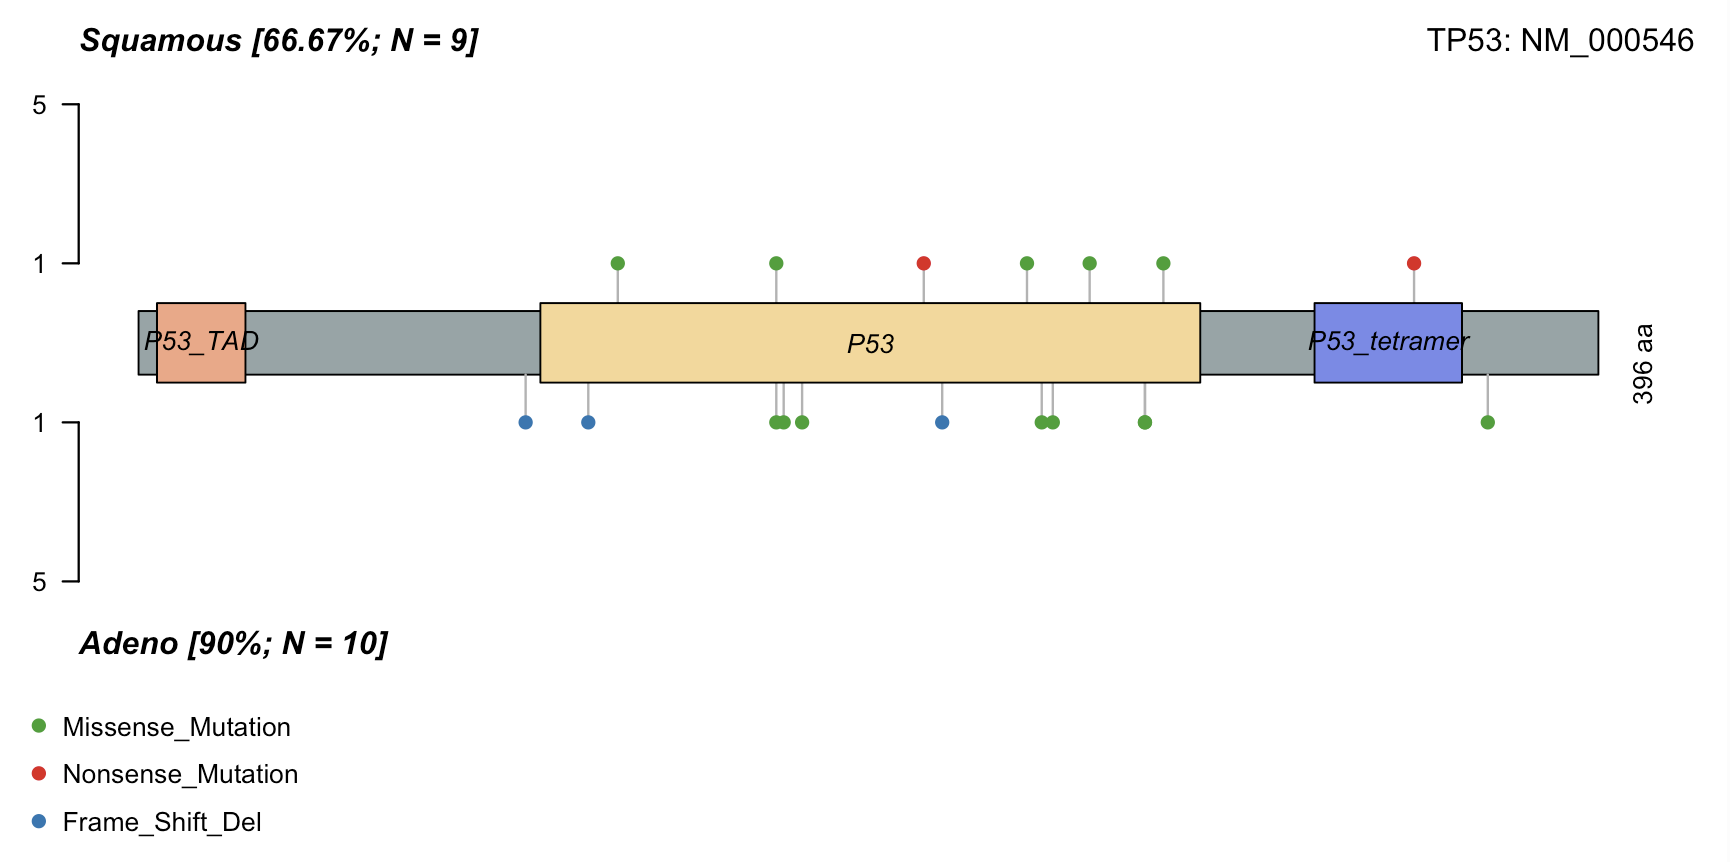
Tracking mutation trends in cancer cohorts
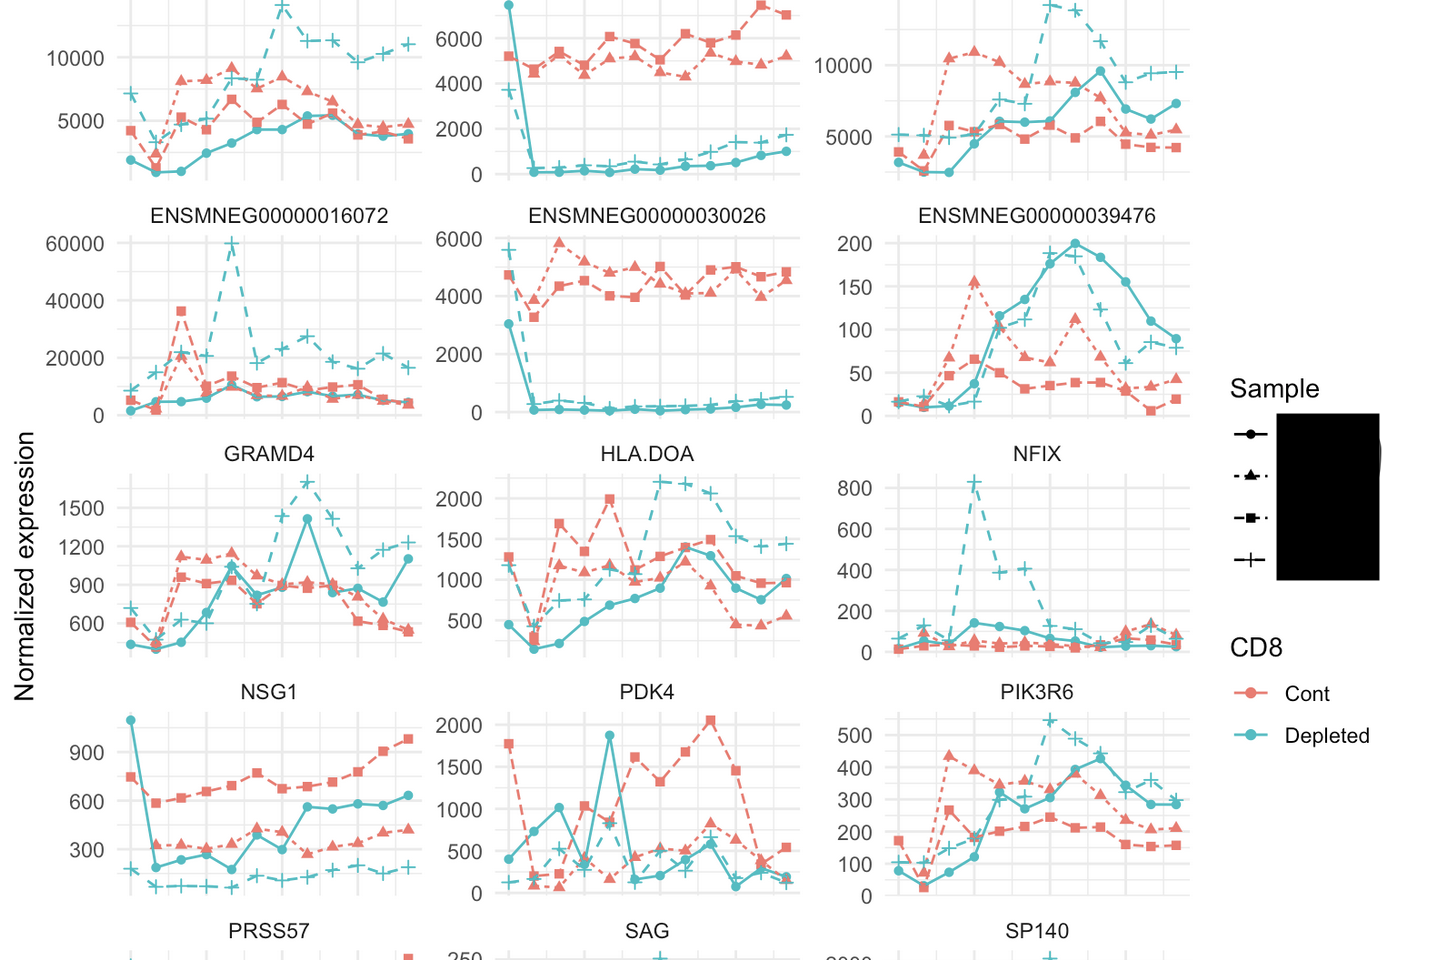
Gene expression in a time-course + intervention study
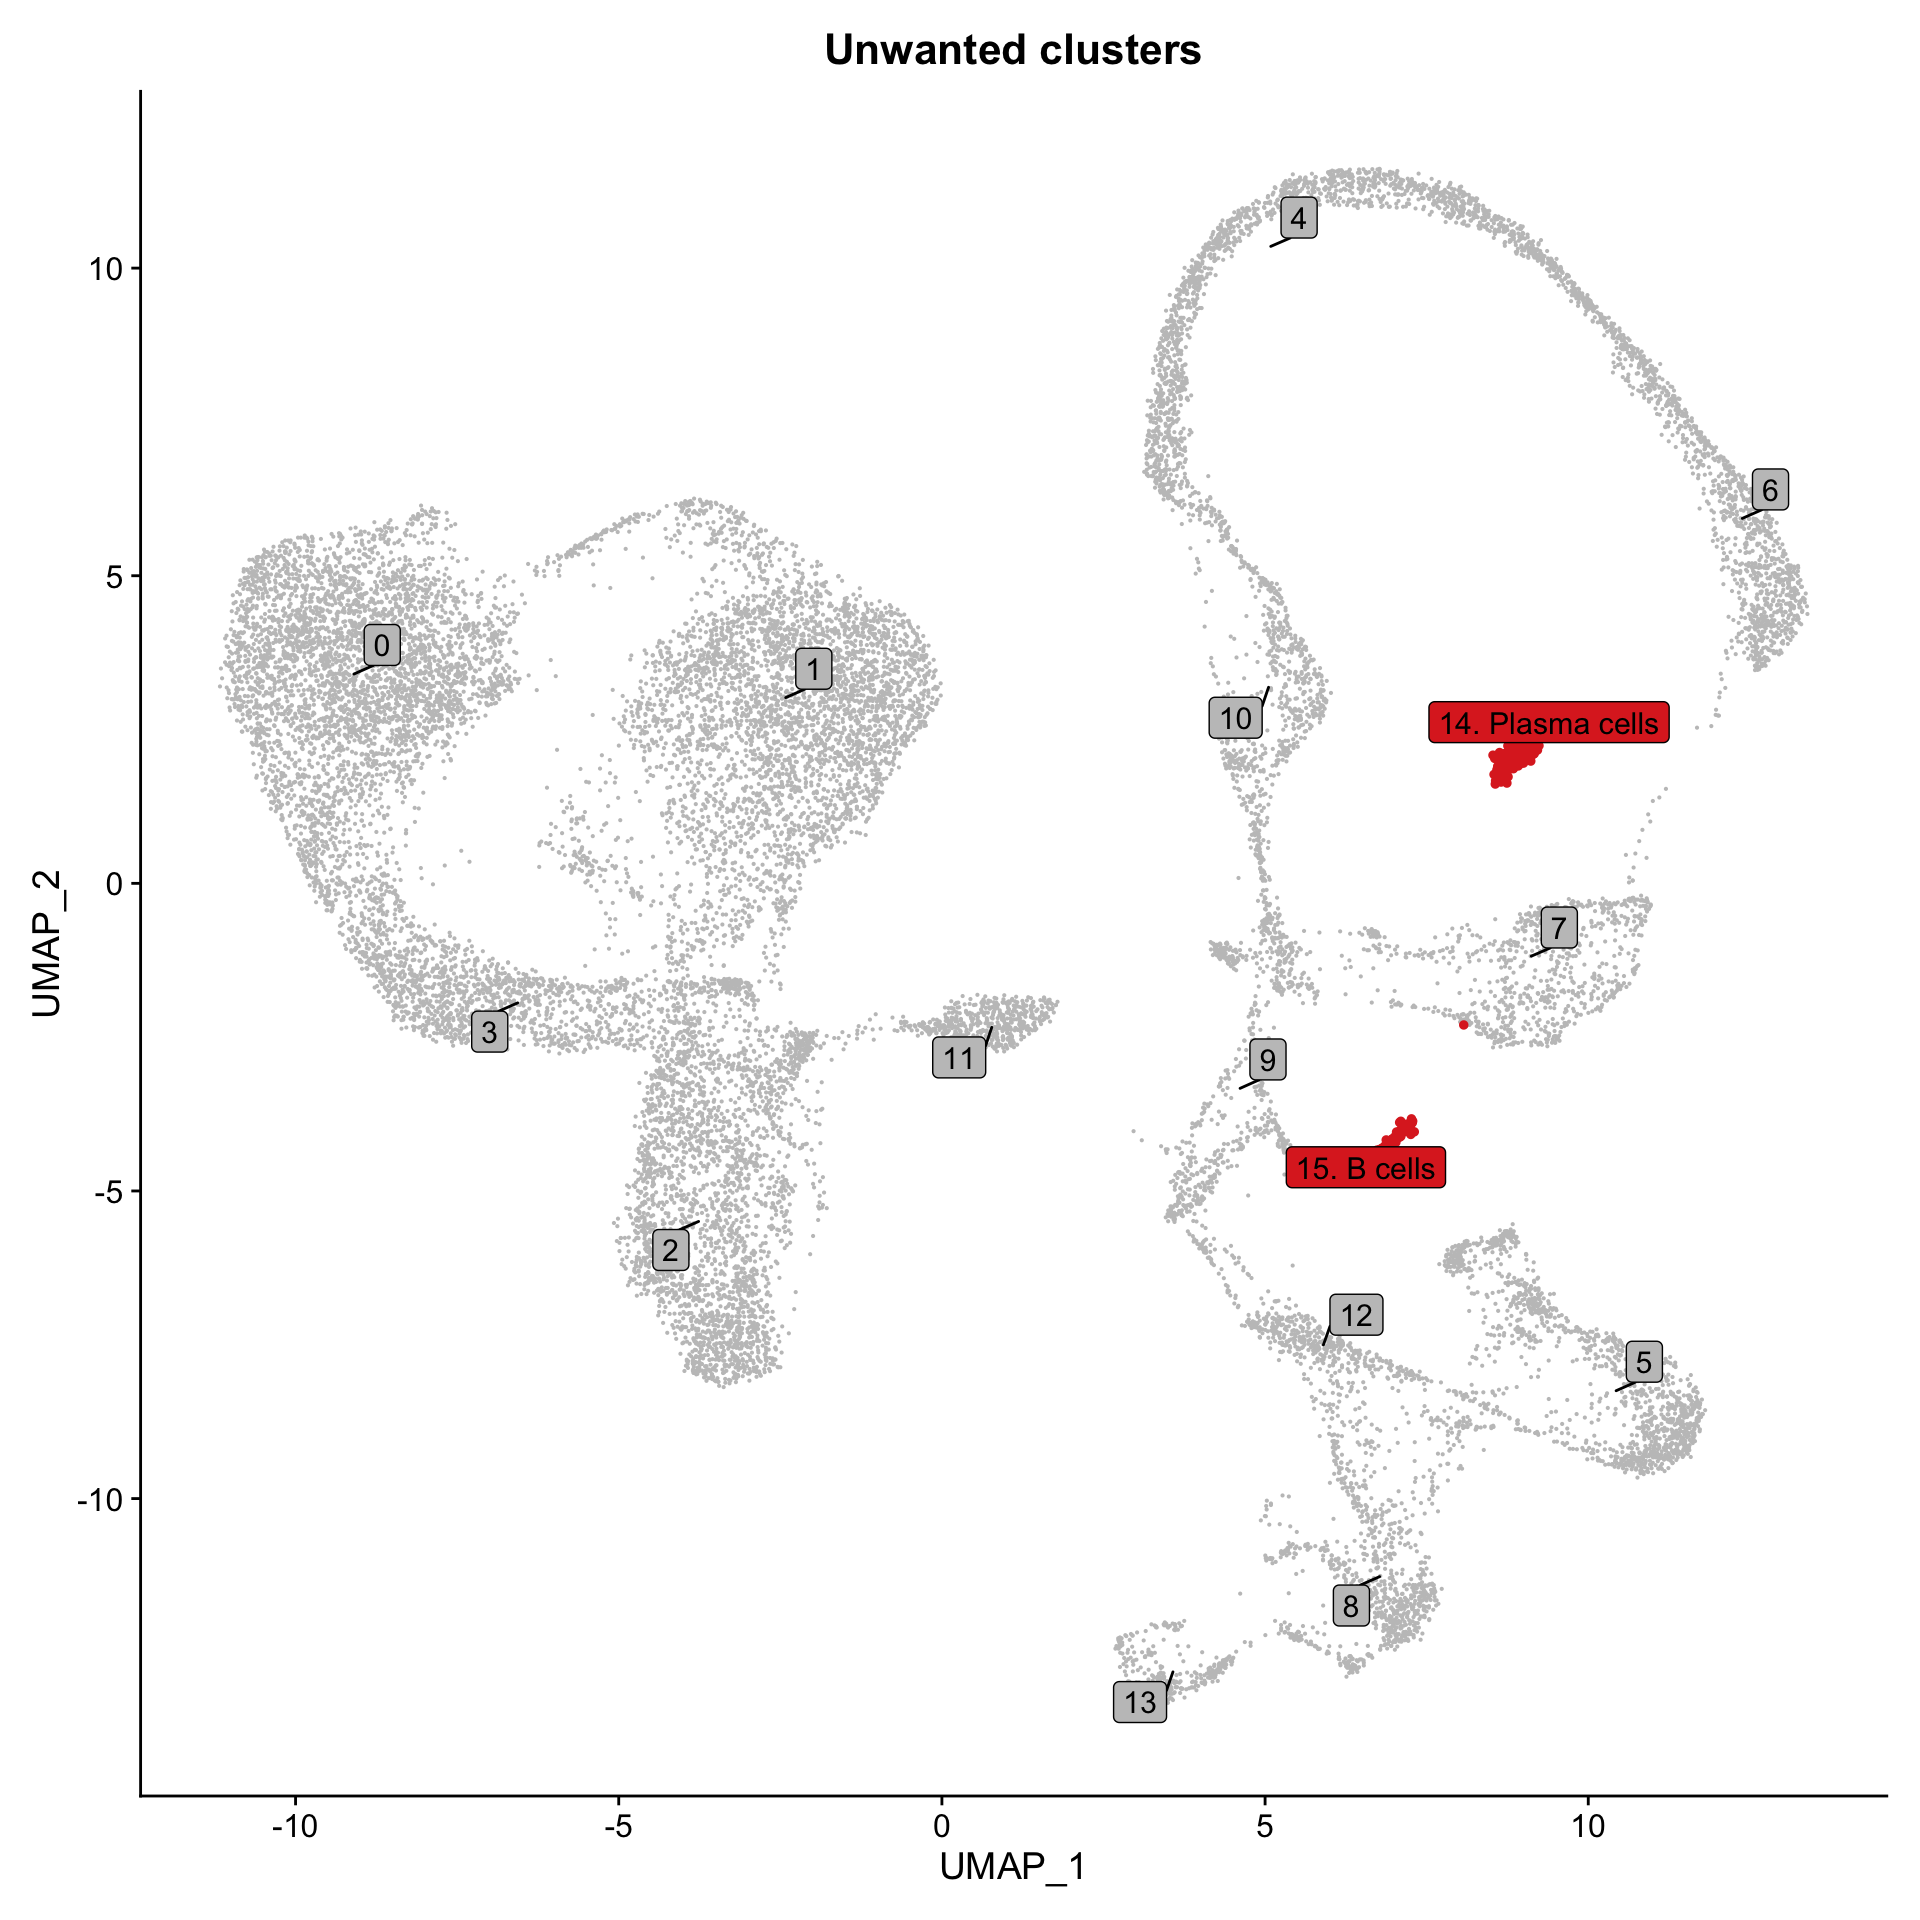
Identifying unwanted celltypes in single-cell data